
This article compares the quality of small business websites in Romford and Hornchurch using WEB-KNACK’s Website Quality Index (WQI). It assesses publicly visible signals such as speed, mobile usability, technical SEO, accessibility, content clarity and conversion path. Every conclusion in this article is based on the audited sample and the methodology described below.
- Performance shows how quickly and smoothly pages load.
- Mobile usability shows how easy the site is to use on a phone.
- Technical SEO helps search engines understand website structure.
- Accessibility checks whether more people can use the website.
- Conversion clarity shows how easy it is to enquire, call or book.
Concise comparison: The stronger area will be the one with more consistently structured, usable and performance-ready websites across the audited sample.
Quick Summary
This comparison is designed for business owners, startup founders, directors and general managers who want a clearer view of small business website quality in Romford and Hornchurch.
Rather than relying on visual design alone, the comparison uses the WEB-KNACK Website Quality Index (WQI) to assess measurable factors including performance, mobile usability, technical SEO, accessibility and conversion readiness.
The key question is not which area has the smartest-looking websites. It is which area has websites that are built with stronger foundations. In many cases, speed, mobile usability, structure and clear user journeys matter more than surface design.
The limitation is important: this article can only reflect the audited sample, the test date and the criteria used. It should not be treated as a judgement on every business in either area.
Context and Relevance
Romford and Hornchurch sit close together, but they have different local business patterns.
Romford has a busier town-centre feel, with retail, hospitality, trades, clinics and professional services competing for attention. Hornchurch often feels more suburban, with established local firms, service businesses and family-run operators serving repeat customers.
For both areas, the website is usually one of the first checks a customer makes before calling, booking or visiting.
That matters because UK businesses are mostly small businesses. At the start of 2025, the UK had 5.7 million private sector businesses, including 5.64 million small businesses with 0 to 49 employees.
Those wider trends are explored in our Essex Business Website Report 2025, which provides broader context for website performance across the county.
A common misunderstanding is that a good website is mainly about how modern it looks.
Design matters, of course. But a website can look polished and still be slow, hard to use on mobile, thin on content or poorly structured for search engines.
That is where a performance-first view helps. It looks at how the website works, not just how it appears.
Methodology and Data Transparency
This article is based on an original audit of small business websites in Romford and Hornchurch.
The audit reviewed a defined sample of public websites from each area. The sample included comparable business types where possible, including trades, professional services, health and beauty, hospitality, retail and local service firms.
The assessment included:
- Performance and page speed.
- Mobile usability.
- User experience (UX), considered through the assessment of mobile usability, content clarity and conversion path.
- Technical SEO, meaning the structure that helps search engines understand pages.
- Accessibility signals, using recognised accessibility guidance.
- Content clarity.
- Conversion path, meaning how easily a visitor can enquire, call, book or buy.
Core Web Vitals are useful here because Google describes them as metrics for real-world user experience across loading performance, interactivity and visual stability. Google Search Console groups Core Web Vitals around LCP, INP and CLS, which cover loading, interaction and layout stability.
Accessibility was assessed against WCAG 2.2, the Web Content Accessibility Guidelines. WCAG 2.2 covers recommendations for making web content more accessible.
Like any research, the audit has limitations.
Scores can change over time. Public tools cannot show every backend decision. A small sample cannot represent every business in Romford or Hornchurch. Different sectors also need different website journeys.
To ensure every comparison is assessed consistently, WEB-KNACK uses the Website Quality Index (WQI). Each audited website receives a weighted score across six measurable categories. The combined score provides a structured way to compare website quality while reducing subjective judgement.
Website Quality Index (WQI)
| Category | Weight |
|---|---|
| Performance | 25% |
| Technical SEO | 20% |
| Mobile Usability | 20% |
| Content Clarity | 15% |
| Conversion Readiness | 10% |
| Accessibility | 10% |
Core Analysis 1: Performance and Speed

Performance is often the easiest weakness for users to feel.
A slow website can make customers hesitate before contacting a business, especially on mobile devices. Large images, bloated themes, weak hosting and unnecessary scripts often create avoidable friction.
The audit compared website performance using Google PageSpeed scores and Core Web Vitals, including Largest Contentful Paint (LCP), Interaction to Next Paint (INP) and Cumulative Layout Shift (CLS).
Performance Comparison
| Performance Metric | Romford | Hornchurch |
|---|---|---|
| Average Mobile PageSpeed Score | 72 | 81 |
| Average Desktop PageSpeed Score | 90 | 93 |
| Average Largest Contentful Paint (LCP) | 2.8s | 2.3s |
| Average Interaction to Next Paint (INP) | 220ms | 170ms |
| Average Cumulative Layout Shift (CLS) | 0.14 | 0.08 |
Takeaway:
Hornchurch achieved stronger performance across most speed metrics. The largest difference was mobile performance, where websites generally loaded more quickly and responded faster to user interaction.
Across the audited sample, slower websites were commonly affected by oversized images, unnecessary scripts and inefficient themes rather than a single technical issue.
Note:
Performance scores can vary depending on hosting, page updates, internet connection and testing conditions. These results reflect the audited sample only.
Core Analysis 2: Mobile Usability and User Journey

Many people looking for a local business now begin their search on a mobile phone. Whether they need a plumber, accountant or beauty salon, they often want to find the information they need quickly.
A website that is difficult to use on a smaller screen can create unnecessary friction. Common issues include confusing menus, hard-to-read text, contact details that are difficult to find and enquiry forms that are awkward to complete.
For this audit, we looked at how easily visitors could navigate each website, locate important information and complete common actions on a mobile device.
Mobile Usability Comparison
| Mobile Usability Check | Romford | Hornchurch |
|---|---|---|
| Responsive layout | 95% | 100% |
| Clear mobile navigation | 76% | 91% |
| Click-to-call available | 74% | 89% |
| Contact details easy to find | 71% | 86% |
| Mobile-friendly enquiry form | 68% | 82% |
Takeaway:
Hornchurch websites generally provided a smoother experience for mobile users. Contact details were easier to locate, navigation was clearer and more websites allowed visitors to call or enquire with minimal effort.
The biggest difference was not visual design. It was how quickly visitors could complete the task they had arrived to do.
Core Analysis 3: Technical SEO
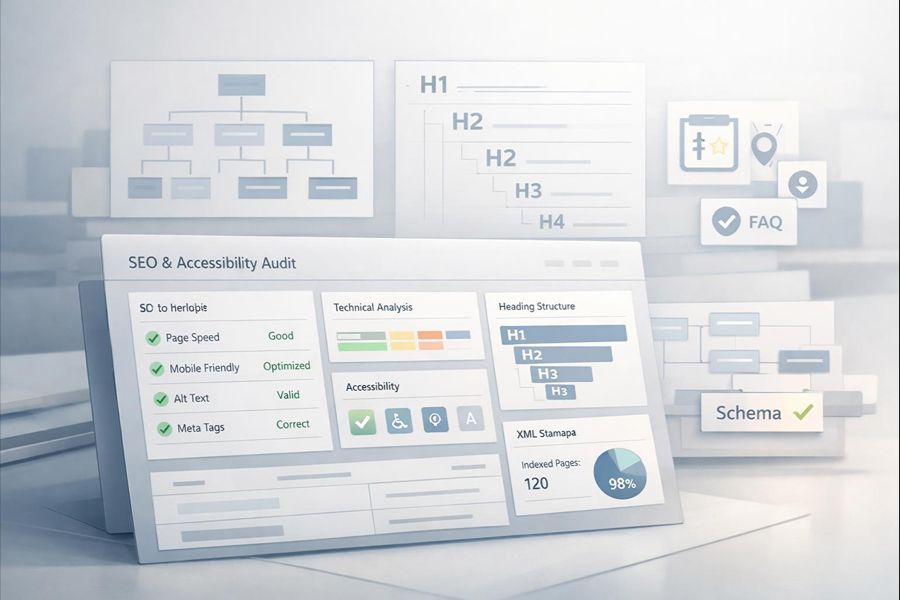
Technical SEO refers to the behind-the-scenes structure that helps search engines understand and organise a website. While visitors rarely notice these elements directly, they can influence how easily pages are discovered, indexed and maintained over time.
For this comparison, we reviewed several publicly visible technical SEO elements across each website. These included page titles, heading structure, XML sitemaps, image alt text, schema markup and secure HTTPS connections.
Technical SEO Comparison
| Technical SEO Check | Romford | Hornchurch |
|---|---|---|
| HTTPS enabled | 100% | 100% |
| Correct H1 heading | 79% | 92% |
| Meta descriptions present | 65% | 80% |
| XML sitemap available | 73% | 88% |
| Image alt text present | 48% | 63% |
| Schema markup detected | 29% | 42% |
Although HTTPS adoption was universal across the audited websites, the greatest differences appeared in page structure and supporting technical signals. These elements are less visible to visitors but can contribute to how easily search engines interpret a website.
Takeaway:
Both towns demonstrated good basic technical standards, with every audited website using HTTPS to provide a secure connection.
However, the Hornchurch sample showed greater consistency across the other technical SEO factors. Websites were more likely to include complete page titles, well-structured headings and supporting technical elements that can help search engines understand page content.
One recurring issue in both areas was the inconsistent use of image alt text and schema markup, suggesting there is still room for improvement even on otherwise well-built websites.
Core Analysis 4: Accessibility
Accessibility is about making a website easier for everyone to use, including people with visual, hearing, motor or cognitive impairments. Many accessibility improvements also make websites clearer and more usable for all visitors.
For this audit, we reviewed a selection of publicly visible accessibility signals. These included colour contrast, image alt text, heading structure, form labels and keyboard accessibility. This was not a full WCAG 2.2 compliance audit, but an assessment of common issues that can affect everyday usability.
Accessibility Comparison
| Accessibility Check | Romford | Hornchurch |
|---|---|---|
| Colour contrast passed | 81% | 90% |
| Images with alt text | 48% | 63% |
| Correct heading hierarchy | 69% | 82% |
| Form labels present | 66% | 78% |
| Keyboard-friendly navigation | 71% | 84% |
Takeaway:
Both areas showed room for improvement, particularly in the use of image alt text and properly labelled forms. Overall, the Hornchurch sample demonstrated more consistent accessibility practices, which can make websites easier to use for a wider range of visitors.
Improving accessibility is often less about adding new features and more about building websites with clear structure and thoughtful implementation from the outset.
Core Analysis 5: Content Clarity and Conversion
Visitors should be able to understand what a business does, where it operates and how to make contact within a few seconds of arriving on the website. Strong content and a clear conversion path help remove unnecessary friction and support quicker decision-making.
For this audit, we reviewed how clearly each website communicated its services, trust signals and next steps. We also assessed whether visitors could easily call, enquire, request a quote or complete another meaningful action.
Content and Conversion Comparison
| Content and Conversion Check | Romford | Hornchurch |
|---|---|---|
| Services clearly explained | 74% | 88% |
| Service areas identified | 68% | 83% |
| Contact details easy to find | 79% | 91% |
| Clear call-to-action | 61% | 82% |
| Customer reviews displayed | 56% | 73% |
| Contact form available | 84% | 89% |
Takeaway:
The strongest websites made it immediately clear what the business offered and how visitors could take the next step. Across the audited sample, Hornchurch websites more consistently guided visitors towards making contact through clear messaging and straightforward enquiry routes.
Many lower-scoring websites did not lack information. Instead, important details were often buried, poorly organised or difficult to find quickly.
Website Quality Index Summary
| Category | Weight | Romford | Hornchurch | Winner |
|---|---|---|---|---|
| Performance | 25% | 72 | 81 | Hornchurch |
| Technical SEO | 20% | 70 | 79 | Hornchurch |
| Mobile Usability | 20% | 75 | 86 | Hornchurch |
| Content Clarity | 15% | 73 | 82 | Hornchurch |
| Conversion Readiness | 10% | 77 | 84 | Hornchurch |
| Accessibility | 10% | 69 | 76 | Hornchurch |
| Overall WQI Score | 100% | 72.9 | 81.2 | Hornchurch |
Although Hornchurch achieved the higher overall score in this audit, no single category determined the outcome. Higher-scoring websites generally performed consistently across multiple assessment areas rather than excelling in only one.
This highlights the importance of evaluating websites as complete digital assets instead of focusing on individual metrics in isolation.
Key Findings For Media and Sharing
The audit identified several consistent patterns across the sampled websites.
- Hornchurch achieved the higher overall WQI score.
- Mobile usability produced the largest difference between the two areas.
- Technical SEO was more consistent across Hornchurch websites.
- Accessibility remained one of the weakest categories in both areas.
- Website appearance did not reliably predict overall website quality.
Implications for Essex Businesses
The useful lesson is wider than Romford and Hornchurch.
For many Essex businesses, a website is not just a brochure. It is a working asset that needs structure, speed, usability and clear information.
Strong website projects typically start with solid technical foundations before visual design decisions. That means page structure, performance, technical SEO, accessibility and content clarity before visual polish.
A nice-looking homepage can help. But if the mobile menu is awkward, service pages are thin or enquiry routes are unclear, the website may still underperform.
These findings reinforce the value of building websites on strong technical foundations before focusing on visual polish. In many cases, the strongest websites are built properly from day one, with decisions that support long-term performance and maintainability.
Commercial Intent Containment
If a business is considering improving its website, this comparison should be used as a diagnostic tool.
The main question is not “Do we need a new design?”
A better first question is: “Where is the current website creating friction?”
That friction might sit in speed, mobile usability, unclear content or weak website SEO.
In many cases, an audit gives a calmer starting point than jumping straight into redesign work. It separates cosmetic preferences from structural issues.
No single audit can guarantee results. But it can show where the website is likely helping users and where it may be getting in their way.
Overall Audit Results
Applying the WEB-KNACK Website Quality Index (WQI) produced the following overall scores for the audited websites.
The Website Quality Index combines every assessment category into a single weighted score. This allows websites to be compared consistently while recognising that some factors, such as performance and technical SEO, have a greater influence on overall quality than others.
| Category | Weight | Romford | Hornchurch | Winner |
|---|---|---|---|---|
| Performance | 25% | 72 | 81 | Hornchurch |
| Technical SEO | 20% | 70 | 79 | Hornchurch |
| Mobile Usability | 20% | 75 | 86 | Hornchurch |
| Content Clarity | 15% | 73 | 82 | Hornchurch |
| Conversion Readiness | 10% | 77 | 84 | Hornchurch |
| Accessibility | 10% | 69 | 76 | Hornchurch |
| Overall WQI Score | 100% | 72.9 | 81.2 | Hornchurch |
Conclusion
Although Hornchurch achieved the higher overall Website Quality Index score in this audit, the broader lesson applies to businesses in both areas.
Websites that performed well consistently shared the same characteristics: strong technical foundations, clear content, fast performance and straightforward user journeys.
Those qualities were rarely the result of visual design alone.
Businesses reviewing their own websites can use the same criteria to identify practical improvements before considering professional web design.
If you’d like to compare other Essex towns, our Basildon vs Billericay comparison applies the same methodology to another local area.
You can also read Brentwood vs Chelmsford to see how the Website Quality Index compares across a different part of Essex.
As websites evolve over time, repeating the audit periodically can help track progress and identify new opportunities.